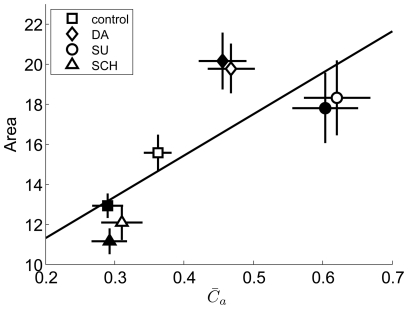
Figure 9. The results of pharmacological experiments showing the relationship between RF area and  .
.
Symbols denote the mean values (open symbols: early-adaptation; filled symbols: late-adaptation) during control (squares), and application with DA (diamonds), SU (circles) and SCH (triangles). Error bars denote S.E.. Correlation coefficient R = 0.78.

