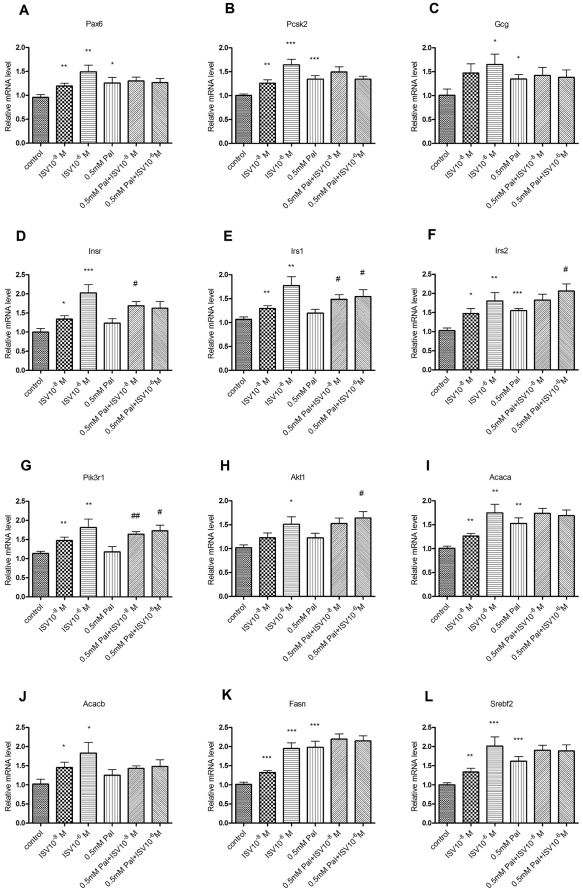
Figure 5. Effects of palmitate and ISV on gene expression.
After 72 h of treatment with or without 0.5 mM palmitate (Pal) in the presence or absence of ISV 10−8 M and 10−6 M, gene expression levels in α-TC1–6 cells were determined and normalized to Hprt. Data is expressed as relative level to control (n = 10–12 samples in each group, RNA extracted from three independent experiments). *P<0.05, **P<0.01, *** P<0.001 vs. control. #P<0.05, ##P<0.01 vs. 0.5 mM Pal.

