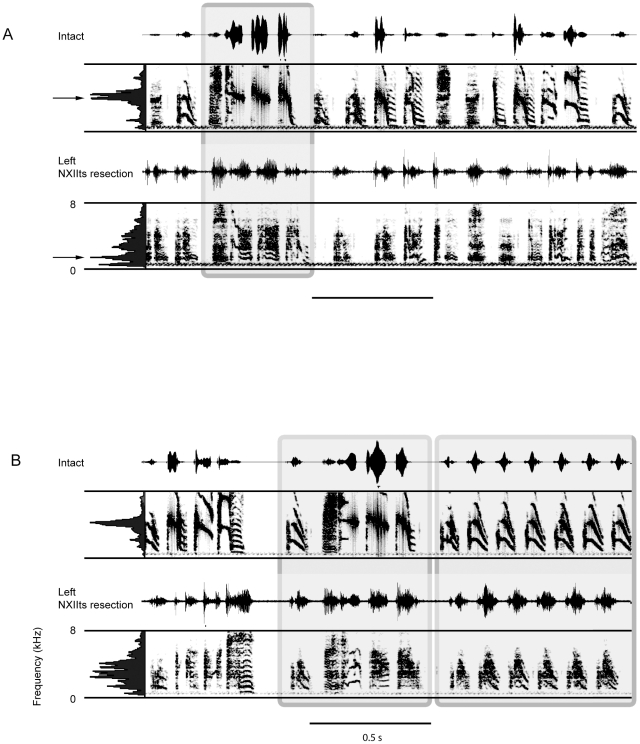
Figure 1. The left side of the syrinx controls the spectral features of song in the Bengalese finch.
A) Spectrograms of the most severely changed song in a Bengalese finch before and after left syringeal denervation. In the intact song, the peak acoustic energy is centered at 4 kHz (indicated by the arrow to the left of mean spectrum), which is common in Bengalese finch songs. Following left syringeal denervation there was a remarkable loss of spectral control of the syllables and a decline in the peak frequency (arrow to the left of the mean spectrum). B) Another example of the effects of left syringeal denervation on the acoustic structure of the Bengalese finch song. In this individual, most of the syllables showed pronounced increase in the “noise”, which corresponds to an increase in entropy, and there was greater energy in the lower frequencies of the song (<4 kHz). Boxes around syllables indicate putative visually matched syllables to illustrate the difficulty in identifying syllables based solely on acoustic structure following left neurotomy.

