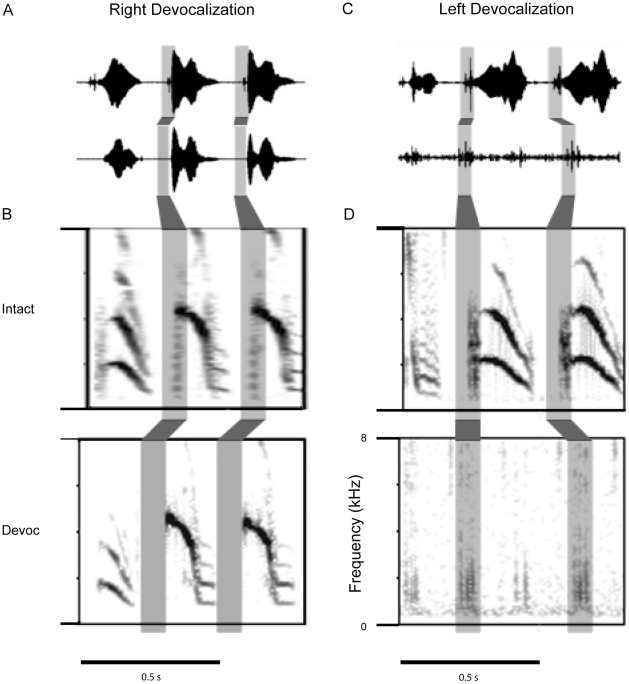
Figure 5. Model for interhemispheric switching during song production.
A,B) An example of the microphone recording of higher peak frequency syllables in the intact recording and following right devocalization. The shaded area indicates the loss of sound at the syllable onset following right devocalization. The spectrograms of the intact and right devocalized syllables are shown with the sound at the syllable onset shaded in gray. This sound is eliminated by right devocalization. C,D) An example of the microphone recording in the intact syllables with a higher peak frequency before and the putative syllable onsets after left devocalization. The spectrograms are displayed below the microphone trace (C). The “clicks” likely represent the syllable onsets without sound production during the remainder of the higher frequency components of the syllables. These data illustrate the high likelihood for rapid interhemispheric switching during song production in Bengalese finches. Many syllables are produced by the syrinx with a lower frequency right side generated sound, followed by a rapid switch the left side for the higher frequency sound production.

