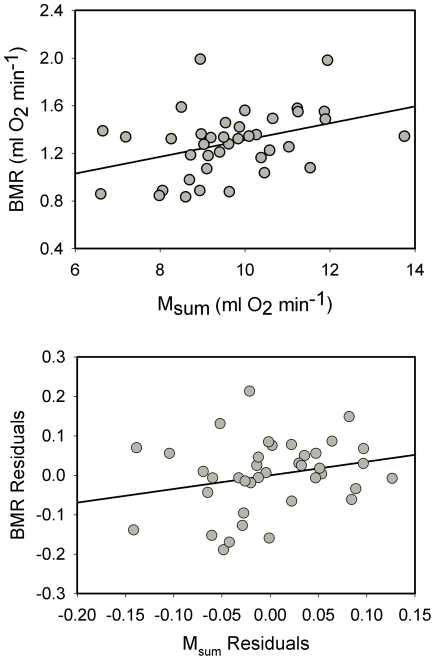
Figure 5. Correlations between BMR vs. Msum for house sparrows.
. Raw BMR and Msum (upper panel) were significantly positively correlated, but mass-independent residuals (lower panel) were not (R2 = 0.060, P = 0.134), indicating that the correlation between raw metabolic values was driven by body mass.

