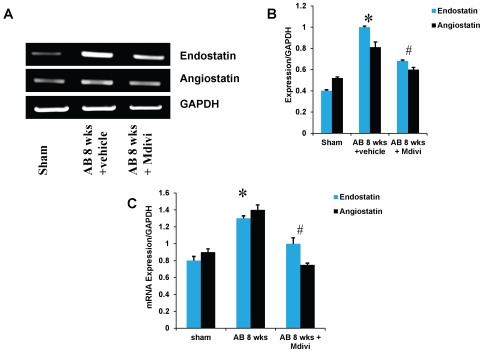
Figure 4. mRNA expression of endostatin and angiostatin primers.
A) RT-PCR: mRNAs are amplified using respective primers and the bands were quantified using densitometry. B, C) Bar graphs represent respective mRNA expression over GAPDH expression by RT-PCR and real time PCR assay. Data represents mean ±SE from n = 6 per group; *p<0.05 was considered significant compared to sham and #p<0.05 compared to vehicle treated group.

