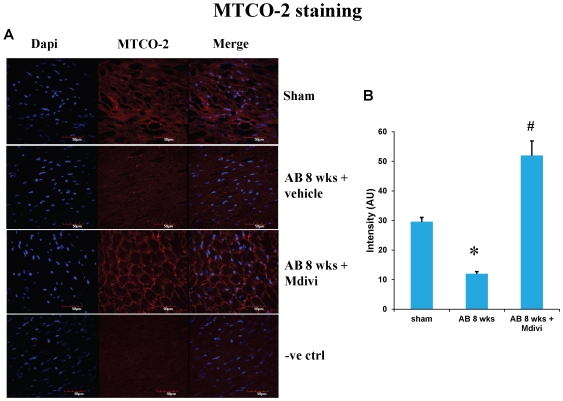
Figure 11. IHC staining of mouse heart sections with mitochondrial marker antibody MTCO-2 in sham, 8 weeks post-AB (AB 8 wks) treated with vehicle control and Mdivi.
A) Expression of MTCO-2 is seen as red fluorescence intensity (scale bar-50 µm). B) Data represents mean ±SE from n = 6 per group; *p<0.05 was considered significant compared to sham and #p<0.05 compared to vehicle treated group.

