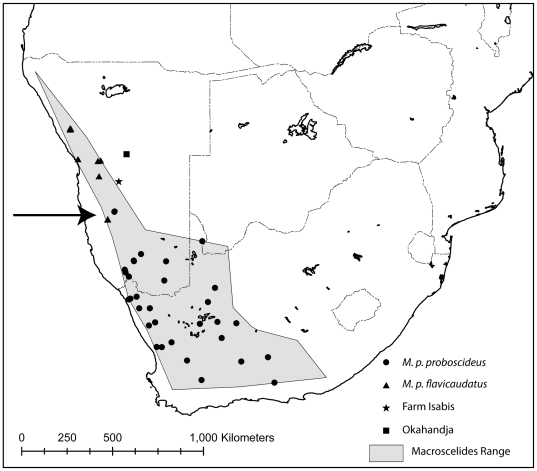
Figure 2. Map of southern Africa, showing the range of Macroscelides.
Localities of specimens used in our analyses are shown (see legend and Methods). The Okahandja and Isabis localities (square and star symbols in central Namibia) of M. p. proboscideus are of questionable validity (see Methods), so we have not included them when calculating the distribution polygon. The arrow points to the area of potential overlap of M. p. proboscideus and M. p. flavicaudatus, between specimen localities on Gorassis (triangle) and Zwartmodder (circle) farms.

