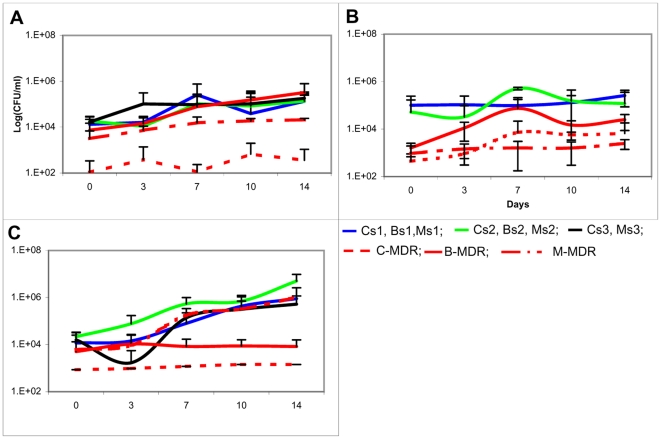
Figure 3. Growth curves of drug susceptible and drug resistant strains in competition.
The growth curves of drug resistant and susceptible strains measured by plating for CFU in 7H9 broth in competition over a period of 14 days have been plotted against time. The data is represented as mean ±SD of 3 independent experiments. (Figure 1A ) represents the growth curves of drug susceptible strain of CAS lineage in competition with the drug resistant strains of the CAS, Beijing and MANU lineage. (Figure 1B ) represents the growth curves of drug susceptible strain of Beijing lineage in competition with the drug resistant strains of the CAS, Beijing and MANU lineage. (Figure 1C ) represents the growth curves of drug susceptible strain of MANU lineage in competition with the drug resistant strains of the CAS, Beijing and MANU lineage.

