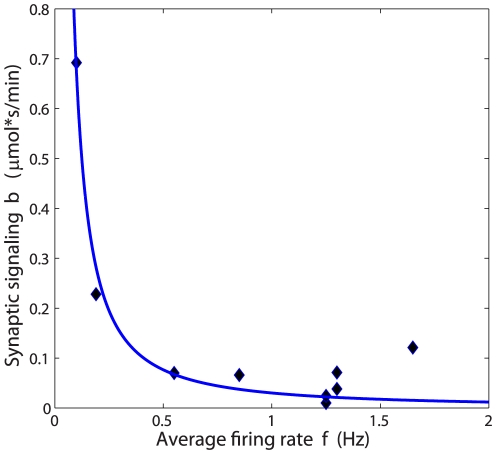
Figure 4. Inverse relationship between synaptic signaling and average firing rate across mammals.
Values of the synaptic efficacy  and firing rates
  (arithmetic means) were found by fitting experimental data to the theoretical model (Table 4). Note that all data points (diamonds) coming from different species and cortical regions align into a universal curve of the form:
  (
( ,
,  ).
).

