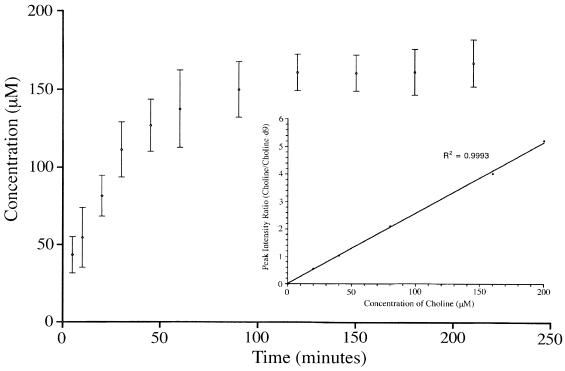
Figure 2.
Kinetics plot for the conversion of ACh to choline at 25°C with an initial substrate concentration of 200 μM and an enzyme concentration of 40 pM. Choline-d9 was added as an internal standard at a concentration of 40 μM. The data follow the increase in the product (choline) as a function of time. Each time point is the average and SD of four measurements. (Inset) Linear calibration of choline vs. internal standard used to relate observed choline peak intensities to concentration.

