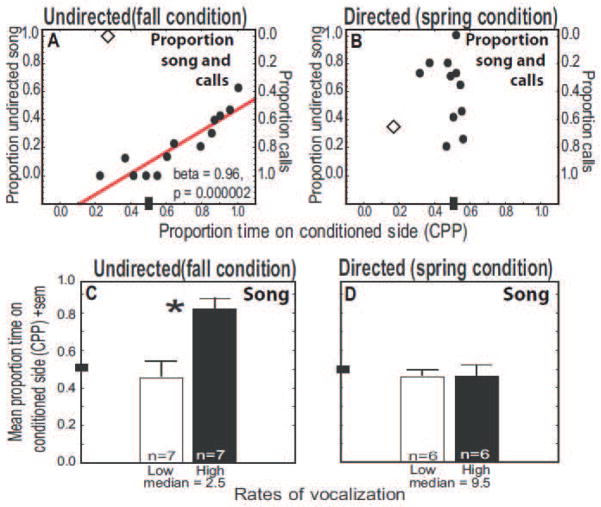
Figure 2.
Evidence linking undirected song and reward in male starlings. A–B) Scatterplots showing correlations between CPP and the proportions of song (y axis on left) and calls (y axis on right) that were A) undirected and B) directed. C–D) Bar graphs showing CPP in males producing low and high rates of C) undirected and D) directed songs. See Figure 1 for additional description of axes. Diamonds in scatterplots indicate statistical outliers not included in the analyses.

