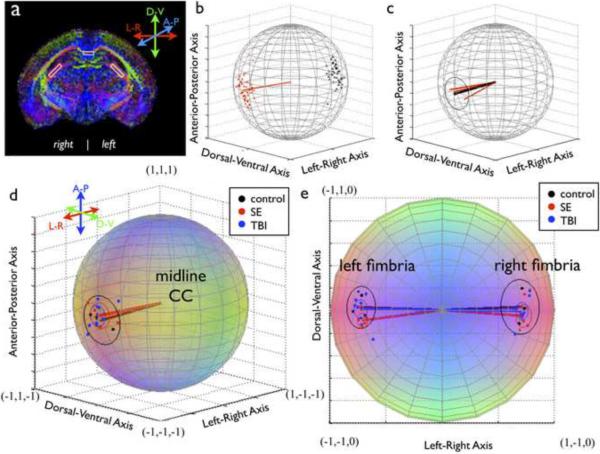
Figure 1.
Determination of DTI directional information. (a) Representative ROIs for the CC and fimbria are shown on a DEC map. The approach for determination of single sample (b) and group (c) directional information for the CC is shown, where red points are included eigenvector measurements, black points are excluded (antipodal) measurements, red lines are single sample direction vectors and the black line is the group mean direction vector. Group analysis is shown for the CC (d) and the fimbria (e) where each colored point represents one sample direction vector and the colored circles correspond to α95 for each group. All plots are on the unit sphere and color coding is consistent with DEC maps (red-left/right; green-dorsal/ventral; blue-anterior/posterior)

