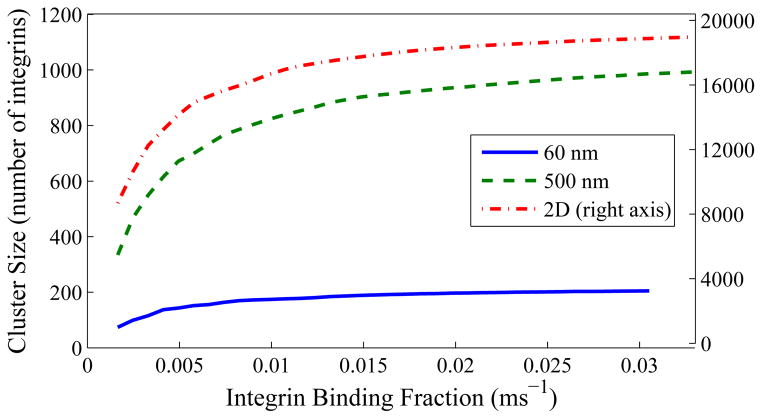
Figure 10.
Maximum viable cluster size as in Figure 9, but with integrin barrier width increased by a factor of 5. Similar, though not identical, behavior can be seen, meaning that while the results can be carried from one integrin type to another, detailed quantitative predictions will depend on integrin type.

