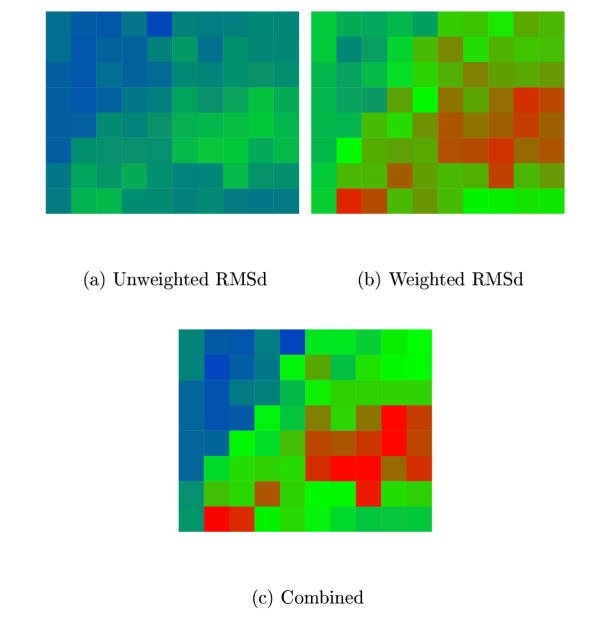
Figure 2.
MLV model agreement. The degree of similarity among the four MLV CA models is plotted for different parameter combinations of MST. Combinations resulting in better agreement have colours towards the red end of the spectrum. (a) Using the unweighted RMSd measure (Fu) and (b) Using the weighted RMSd measure (Fw). (See Methods Sectn. for details.) (c) Combined score (Fu·Fu). The MST parameters varied were X-axis: S = 0→9 (in steps ofone) and Y-axis: G = 10→90 (in steps of 10). (See Methods Sectn. for details.) The best combined score is at: S = 7, G = 30.

