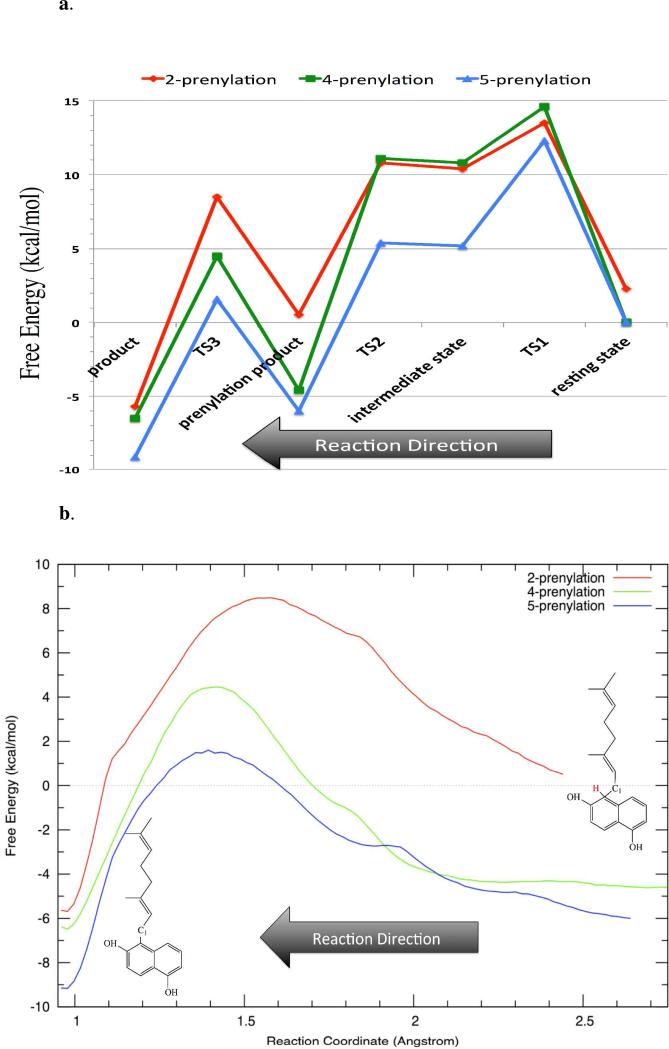
Figure 8.
(a) Computed free energy chart for the entire reaction course and (b) computed free energy profile for the proton transfer step for the three experimentally observed products (Note: reaction direction is from LEFT to RIGHT.). Note: (a) TS1 – carbocation formation step; TS2 – prenylation reaction step; TS3 – proton transfer step. (b) the starting points are chosen based on their corresponding prenylation product states and free energies shifted accordingly.

