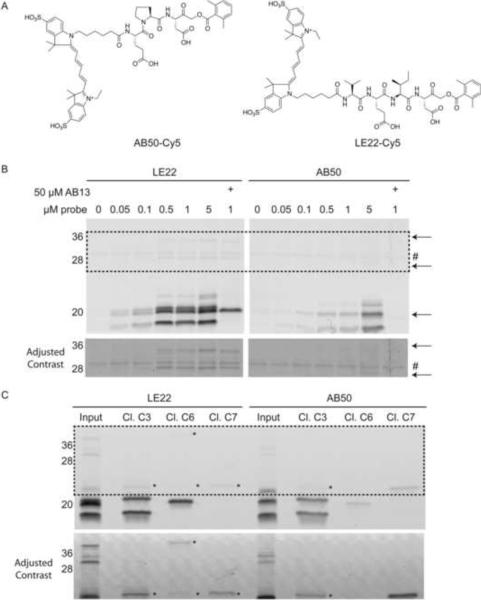
Figure 1. Direct comparison of LE22 and AB50 labeling in intact apoptotic cells.
(A) Structure of the previous generation caspase probe, AB50, and the optimal probe from the new series, LE22. (B) Fluorescent SDS-PAGE comparing LE22 and AB50 labeling of apoptotic Human colorectal cancer COLO205 cells. Cells were induced to undergo apoptosis using anti-DR5 and intact cells were labeled with each probe at the indicated concentrations. Where indicated, the caspase-3 and -7 specific inhibitor, AB13 was added prior to labeling with the probes. Total protein lysates were analyzed by SDS-PAGE followed by scanning for Cy5 fluorescence using a flatbed laser scanner. An autofluorescent protein is indicated with a #. Arrows highlight caspase-6 species that are labeled by LE22 but not by AB50. The bottom panel shows enhanced contrast of the boxed region for easier viewing of the high molecular weight bands. (C) Immunoprecipitations using the indicated cleaved caspase antibodies to confirm the identity of labeled proteins in the 5 μM samples in (B). Faint bands in the pulldowns that are difficult to see are noted with an asterisk, and the bottom panel shows enhanced contrast for easier viewing. (See also Figure S1 and S2)

