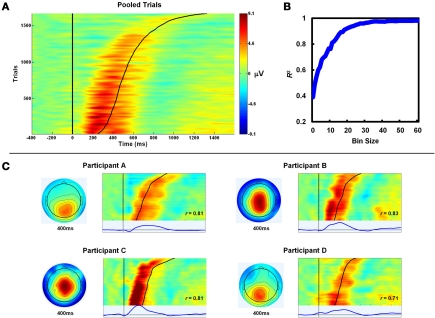
Figure 3.
PeC latency correlates with the timing of awareness. (A) Single-trial aware error PeC waveforms locked to the erroneous response, pooled across participants and sorted by Aware RT (black line). For visualization, trials were smoothed across bins of 30 trials with a Gaussian-weighted moving average. Note how PeC peak latency closely tracks Aware RT. (B) To minimize the effect of noise in the single-trial measures on the observed relationship, the pooled single-trials were again sorted by Aware RT and, through repeated iterations, averaged across bins of increasing size (1–60; see text for details). The variance in Aware RT explained by Pe latency (R2) increased with bin size up to approximately 25 trials. (C) Topographies and trial sortings (including average component waveforms) for a subset of four participants. R-values at inset refer to correlation coefficients between single-trial PeC latency and Aware RT for that participant.

