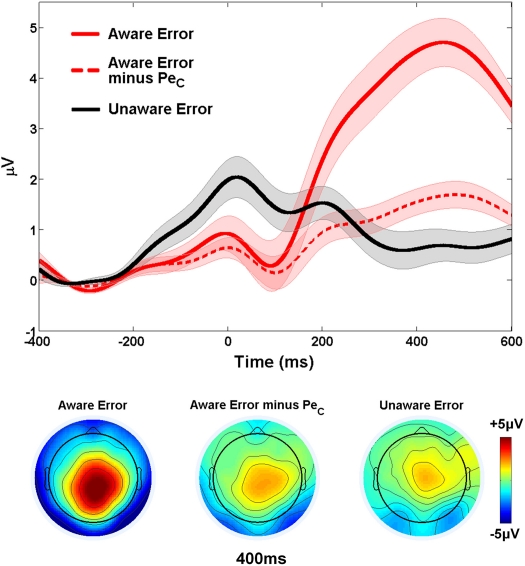
Figure 6.
Validation of Study 1 PeCs. The difference in waveform amplitude between aware and unaware errors within the relevant PeC latency range was substantially reduced when all variance related to the PeC was removed from aware error traces. Shaded regions around waveforms represent error bars (SEM).

