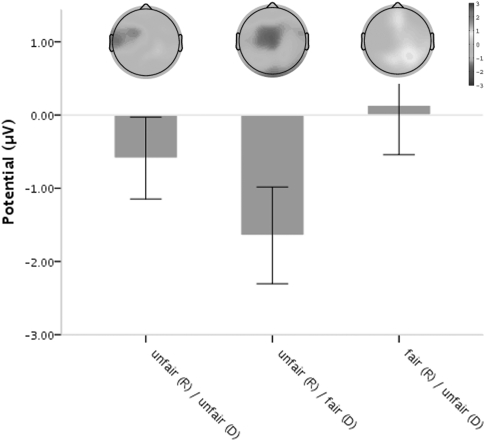
Figure 3.
Scalp potential topography of the average voltage differences between equal offers (fair/fair) and the three unequal offers (fair/unfair, unfair/fair and unfair/unfair) for the time point of the MFN (240–340 ms following offer onset). The bar chart depicts the respective mean MFN amplitude values. Error bars indicate 1 SE.

