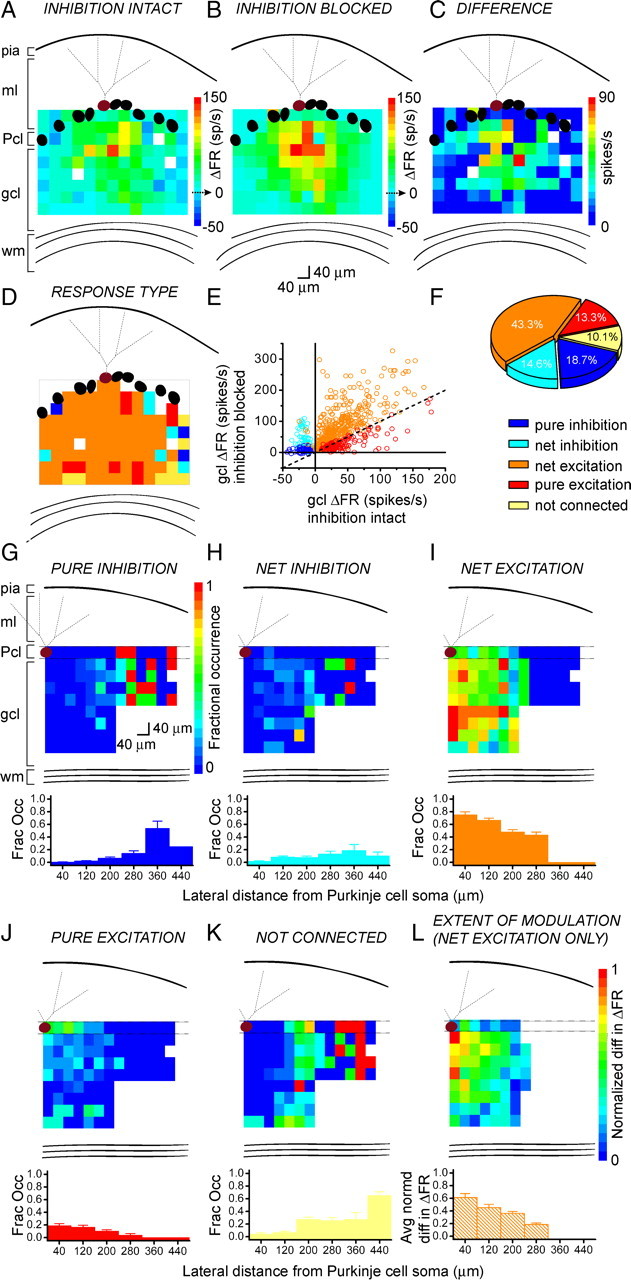
Figure 4.

The different response types are stereotypically organized. A, B, Pseudocolor response maps of a single Purkinje cell in terms of change in firing rate with respect to baseline (ΔFR), with inhibition intact (A) or blocked (B). The baseline firing rates of the cell were 36 and 41 spikes/s, respectively. C, From the same cell as in A and B, the difference map generated by subtracting the values in A from those in B. D, The responses of the same Purkinje cell as in A–C were color-coded according to response type (see F for legend). E, The responses evoked from granule cell photostimulation in 12 cells are plotted in terms of change in firing rate with inhibition blocked, as a function of change in firing rate with inhibition intact, and colored according to their response type (see F for legend), assigned as described in Materials and Methods. The plot shows a wide range in which inhibition can modulate Purkinje cell output. F, The distribution of response types obtained from two cells in which the recorded Purkinje cell was placed at the edge of the photolysis grid. G–K, Top, The average probability of obtaining one of the five response types at each map coordinate, calculated from 12 cells. The number of a given response type at each map coordinate was divided by the total number of cells sampled at that coordinate, to yield the fractional occurrence of each response. Bottom, Vertically collapsed averages from the overlying maps, binned at 80 μm. L, An average ΔFR difference map as in C was generated from 12 individual maps. The data were normalized to the maximum difference.
