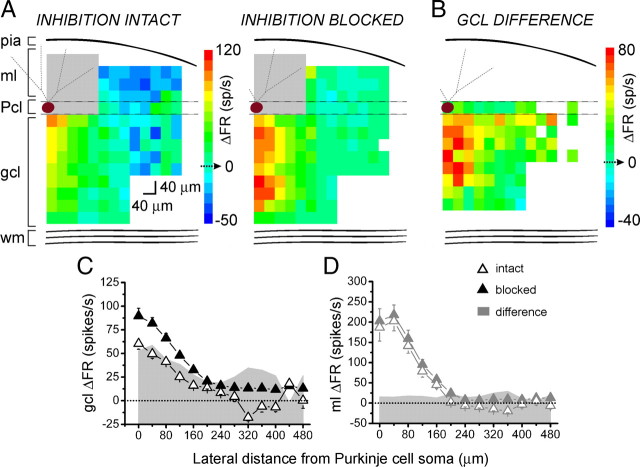
Figure 5.
Quantification of inhibition in the extended maps. A, Average pseudocolor response maps of 12 Purkinje cells in terms of change in firing rate with respect to baseline (ΔFR), with inhibition intact (left) or blocked (right). B, The average difference map of the same 12 cells as in A for granule cell patches identified in Figure 4 as those which mediated inhibition. C, D, Compiled vertically collapsed average profiles of Purkinje cell responses to glutamate photorelease in the sagittal orientation in the granule cell layer (C) or the molecular layer (D), as in Figure 1, G and H. Data were compiled from the 12 maps analyzed in A. The open and closed triangles denote responses with inhibition intact and blocked, respectively. The gray area plots show the difference in change in firing rate between the two conditions.

