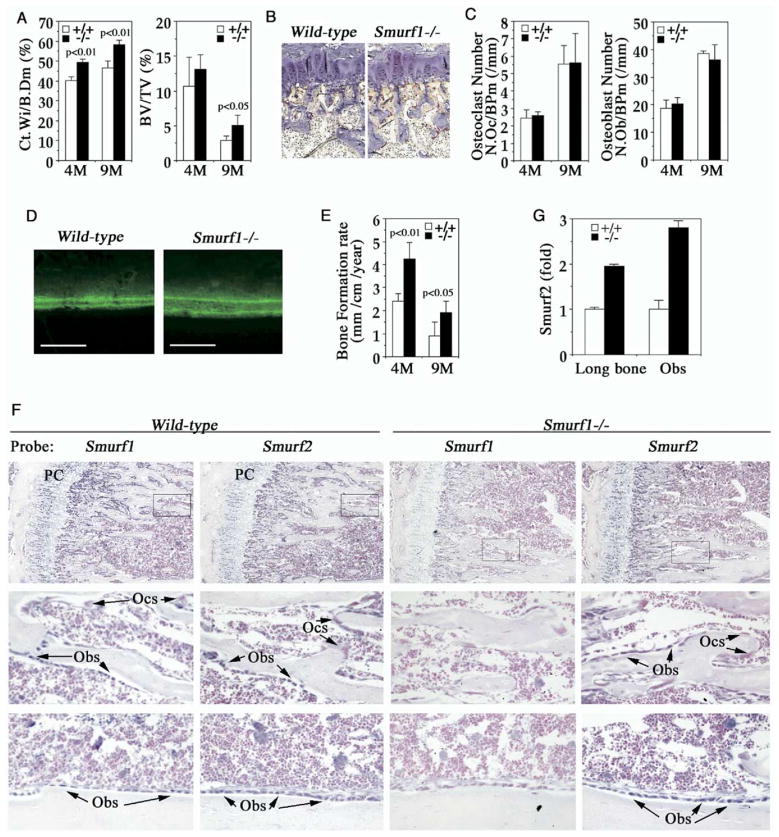
Figure 2. Enhanced Osteoblast Activity in Smurf1−/− Mice.
(A) Bone morphometric analyses of 4- and 9-month-old male mice (n = 4). Ct.Wi/B. Dm, cortex bone width per bone diameter; BV/TV, trabecular bone volume per tissue volume. Statistical difference between two mice groups was assessed by Student’s t test.
(B) TRAP staining of osteoclasts in proximal epiphysis of tibia from 4-month-old mice.
(C) Quantification of osteoclast (left) and osteoblast (right) cell numbers.
(D) Calcein-labeled mineralization fronts in tibiae cortex bone from 4-month-old mice by fluorescent micrography. Scale bar = 0.2 mm.
(E) Quantification of bone formation rate measured with calcein double-labeling.
(F) In situ hybridization analyses of Smurf1 and Smurf2 expression in tibia at the metaphysis (top panels) and near cortical bone (bottom panels). (Middle panels) Insets of top panels at higher magnification. Sections were counterstained with nuclear fast red. PC, proliferative chondrocytes; Obs, osteoblasts; Ocs, osteoclasts.
(G) Real-time RT-PCR measurement of Smurf2 transcript from lone bones or osteoblasts.

