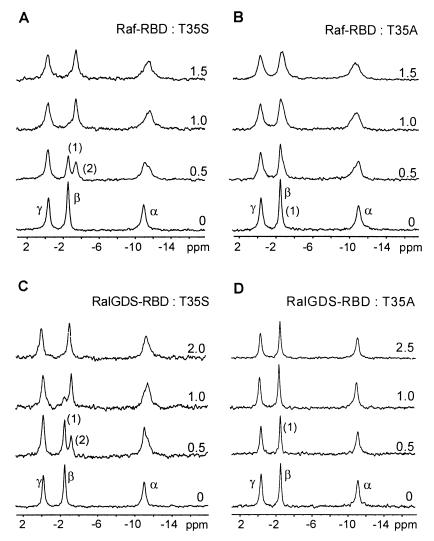
Figure 4.
31P-NMR spectroscopic analysis of complex formation between Ras(T35S) (A and C) and Ras(T35A) (B and D) in the GppNHp form and cRaf-RBD (A and B) and RalGDS-RBD (C and D). Increasing amounts of the effectors were added to 1–2 mM Ras protein, and spectra were recorded as described in Fig. 1 and Methods. The ratio of RBDs to Ras proteins is indicated. The chemical shift values are summarized in Table 2.

