
Figure 2.
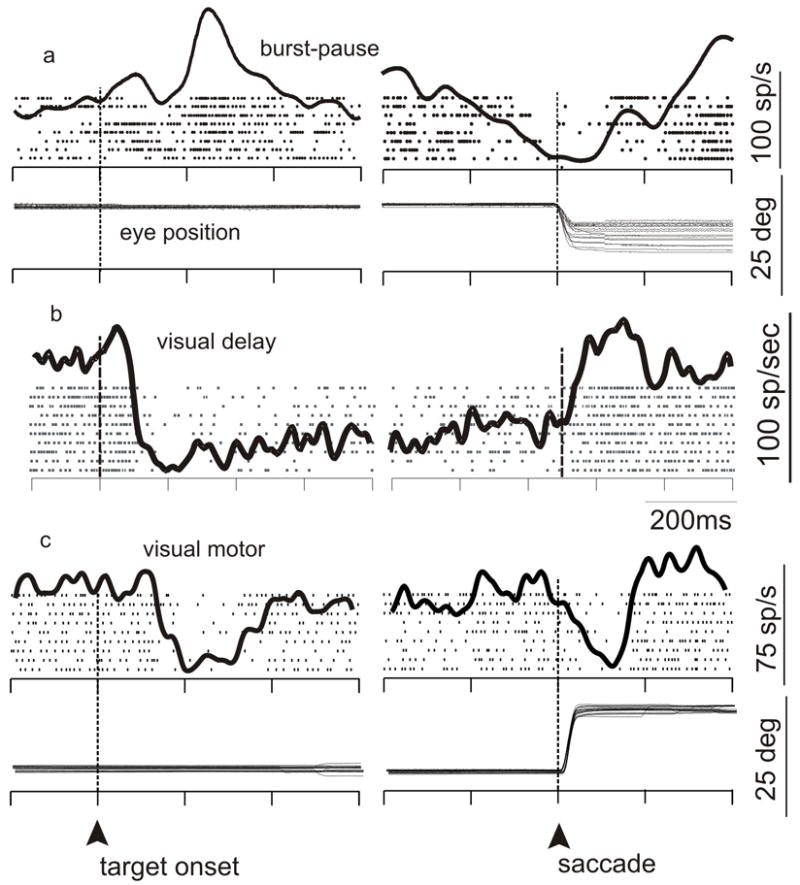
Activity of nigral neurons around the time of saccades. a-c. The discharges of three neurons recorded from the nigra in an alert monkey that performed a delayed-saccade task. Each tick indicates the time of occurrence of one action potential. Each row of ticks indicates a single trial in which a correct saccade was made to a visual stimulus that was located in the periphery of the visual field. The envelope of activity overlain on the raster plot shows the spike density function. Data are aligned on events in the task as indicated by the upward arrow and the dashed, vertical line. At left, data are aligned on the onset of the visual target; at right, data are on the onset of the saccade. H Eye, horizontal eye position; V Eye, vertical eye position. a. Example of a neuron that shows an increase for the onset of a target and reduces its discharge well in advance of the onset of a saccade. b. Example of a neuron that reduces its discharge well before the onset of a saccade. c. Example of a neuron that reduces its discharge for the onset of visual stimuli and then again at the time of saccade onset.