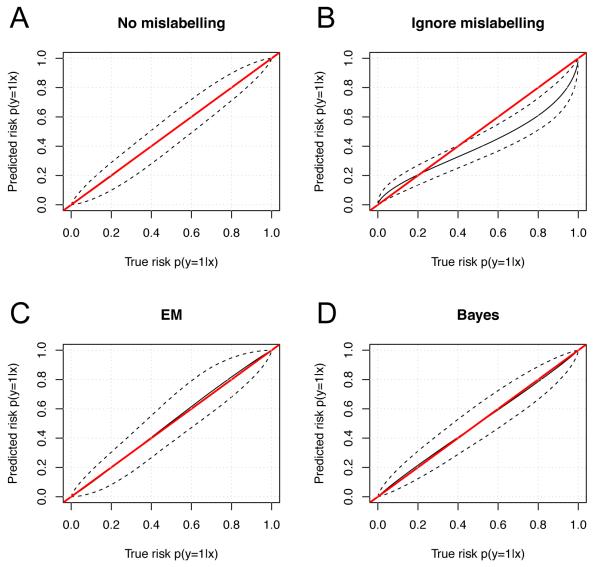
Figure 1.
Bias in predicted risk under 10% mislabelling. Each panel show the predicted risk (median (black line) and 95% confidence interval (dashed line) from resampling (10000 samples)) plotted against the true risk. A) Conventional model and data with no mislabelling. B) Conventional model and data with 10% mislabelling of controls. C) EM model with 10% mislabelling of controls D) Bayesian model with 10% mislabelling of controls.

