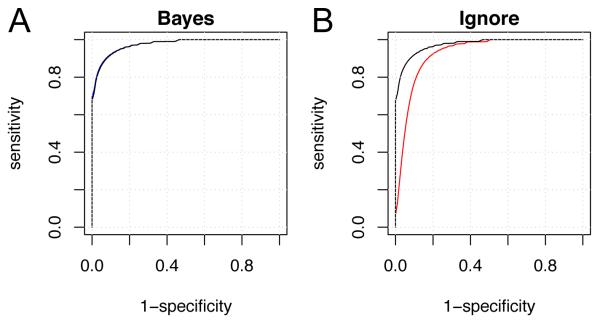
Figure 2.
The impact of class label uncertainty on prediction performance evaluation. The ROC curve represent the median across 10000 simulation rounds. A) ROC curve for a model incorporating label uncertainty (blue) and ROC curve estimated from a data set with no mislabelling (black). B) ROC curve for a conventional model (red) and ROC curve estimated from a data set with no mislabelling (black).

