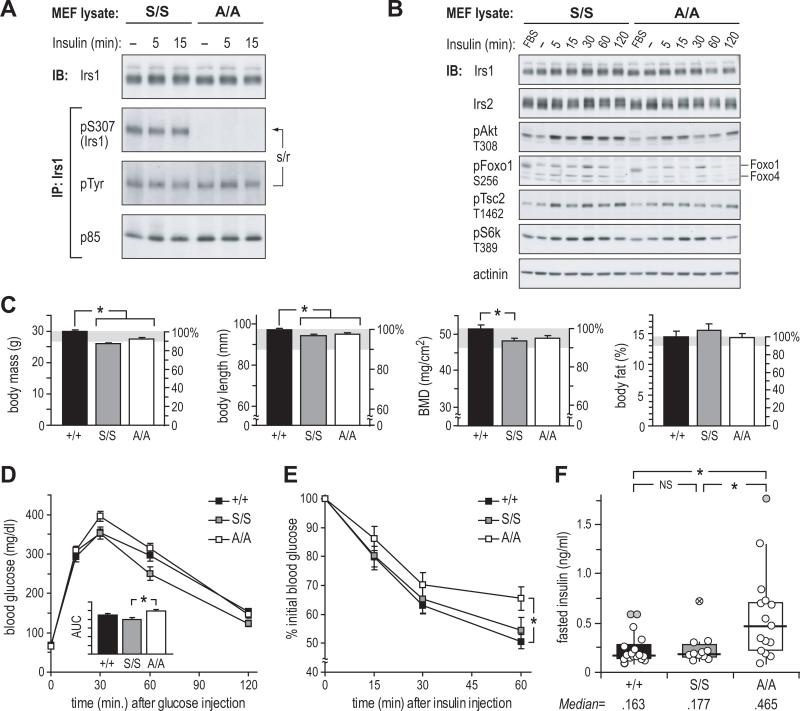
Figure 1. Irs1 Ser307Ala Knock-in Mice Are Insulin Resistant Versus Control Knock-in and WT Mice.
(A and B) Immunoblot analysis of insulin signaling in control (S/S) and mutant (A/A) knock-in mouse embryonic fibroblasts (MEF); cells were maintained in 10% serum (FBS), or fasted (–) 16h before treatment with 100nM insulin; IP: immunoprecipitation; IB: immunoblot; s/r: stripped/reprobed membrane.
(C) DEXA analysis of 16-week-old WT (+/+), control knock-in (S/S), and mutant knock-in mice (A/A). Bars show mean ± SEM; BMD: bone mineral density.
(D and E) Glucose tolerance test and (E) insulin tolerance test in 5-month-old chow-fed mice; AUC: area under curve (mean ± SEM, arbitrary units).
(F) Fasted plasma insulin at time=0 of GTT; box: interquartile range (IQR); horizontal bar: median; vertical bar: 95% of distribution. The exclusion of tailing outliers (> 1.5×IQR:  and > 3×IQR:
  ) gave trimmed medians of 159 (+/+), 175 (S/S) and 404 pg/ml (A/A), yielding significance (p < 0.05) for the comparison of A/A vs. S/S insulin distributions.
* = p < 0.05.

