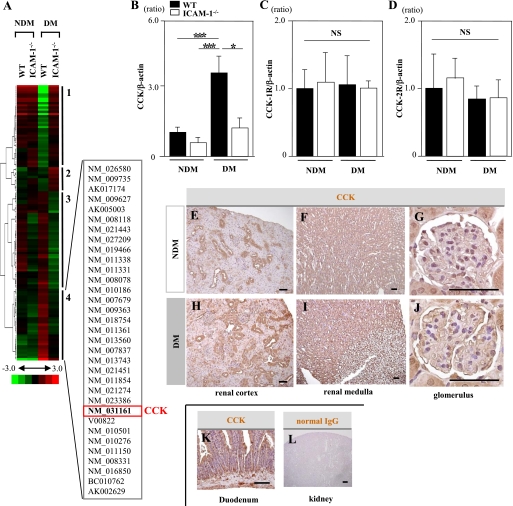
FIG. 1.
The expression and distribution of CCK in kidney tissues of mice.A: Cluster analysis of differentially expressed genes comparing NDM WT and ICAM-1−/− mice and STZ-induced DM WT and ICAM-1−/− mice (n = 5/group). The dendrogram on the left of the cluster shows the relatedness of the change in gene expression. On the right of the cluster diagram, four groups of genes (1–4) are identified based on their gene expression changes. The list of constitutive genes involved in cluster 4 is given using the GenBank accession numbers. CCK was included in this cluster. B: CCK mRNA expression in the renal cortices was significantly increased in diabetic WT mice and significantly reduced to a nondiabetic level in diabetic ICAM-1−/− mice. C and D: The mRNA expressions of CCK-1R and CCK-2R were almost the same among the four groups. Values (means ± SEM) are presented as the ratio of nondiabetic WT. Data shown are representative of three separate experiments performed with five mice per group. E–G: Immunohistological staining of renal tissue specimens obtained from nondiabetic WT mice. The CCK-positive area was mainly observed in the distal tubules (E) and collecting ducts (F) and weakly in glomeruli (G). H–J: Immunohistological staining of kidney tissue specimens obtained from diabetic WT mice. The distal tubules (H) and glomeruli (J) were stained more intensely compared with those in the nondiabetic WT mice. A duodenal tissue specimen was used as a positive control (K). Normal IgG was also used as a negative control (L). Scale bars, 50 μm. *P < 0.05. ***P < 0.001. NS, P > 0.05. (A high-quality digital representation of this figure is available in the online issue.)

