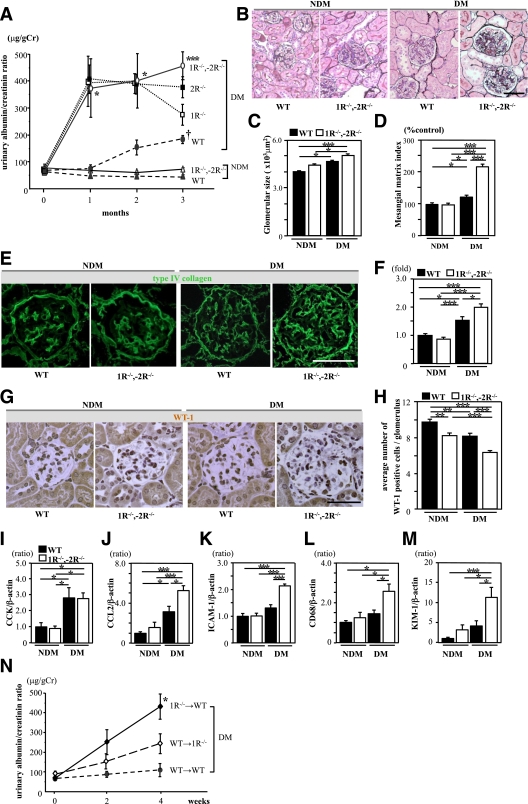
FIG. 2.
Diabetic CCK-1R−/−,-2R−/− mice exhibited increased albuminuria and enhanced proinflammatory genes in the kidney. A: Time course of urinary albumin/creatinine ratio (UACR). The UACR of diabetic CCK-1R−/−,-2R−/− mice (○) was markedly increased as compared with that of diabetic WT mice (●) (n = 7/group). The UACR of CCK-1R−/−,-2R−/− mice was higher than that of CCK-1R−/− mice (□) or CCK-2R−/− mice (■) at 3 months. *P < 0.05 vs. diabetic WT and nondiabetic groups; ***P < 0.001 vs. diabetic WT and nondiabetic groups; †P < 0.05 vs. nondiabetic groups. B: PAM staining of the kidney at 3 months. Scale bars, 50 μm. C: Glomerular hypertrophy was observed in both diabetic groups as compared with nondiabetic WT mice (n = 5/group). *P < 0.05; ***P < 0.001. D: The mesangial matrix index, calculated by the PAM-positive area in the tuft area, was significantly increased in diabetic CCK-1R−/−,-2R−/− mice as compared with the other three groups. Ten randomly selected glomeruli per mouse were examined (n = 5/group). *P < 0.05; ***P < 0.001. E: Expression of type IV collagen in kidney tissue. Scale bars, 50 μm. F: Collagen IV-positive area in glomeruli (folds versus the nondiabetic WT group). Type IV collagen was significantly increased in the diabetic CCK-1R−/−,-2R−/− group compared with the diabetic WT group. Fifteen randomly selected glomeruli per mouse were examined (n = 4/group). *P < 0.05; ***P < 0.001. G: Expression of WT-1 in glomeruli. H: The average number of WT-1–positive cells in glomeruli. Podocyte loss was significantly increased in diabetic CCK-1R−/−,-2R−/− mice as compared with the other three groups. Twenty randomly selected glomeruli per mouse were examined (n = 4/group). Values are the means ± SEM. **P < 0.01; ***P < 0.001. Scale bars, 50 μm. I–L: Expression of CCK and proinflammatory genes in the renal cortex. Expression of CCK was significantly increased to similar levels in both diabetic groups compared with the nondiabetic groups, whereas the expressions of CCL2, ICAM-1, and CD68 were significantly upregulated only in the diabetic CCK-1R−/−,-2R−/− group (n = 6/group). Values are presented as ratio of nondiabetic WT. Results (mean ± SEM) are representative of three independent experiments. M: Expression of KIM-1 gene in the kidney. Expression of KIM-1 was significantly increased in diabetic CCK-1R−/−,-2R−/− mice as compared with the other three groups (n = 6/group). Values are presented as the ratio of nondiabetic WT. Results (mean ± SEM) are representative of three independent experiments. N: Time course of UACR after induction of diabetes. The UACR of WT mice that received a bone marrow transplant from CCK-1 receptor-deficient mice (1R−/− →WT; ♦) was markedly increased after induction of diabetes as compared with that of other groups. WT→WT (●), WT mice that received a BMT from WT mice; WT→1R−/− (◇), CCK-1 receptor-deficient mice that received a BMT from WT mice. Values are the means ± SEM. *P < 0.05 vs. other groups. (A high-quality digital representation of this figure is available in the online issue.)

