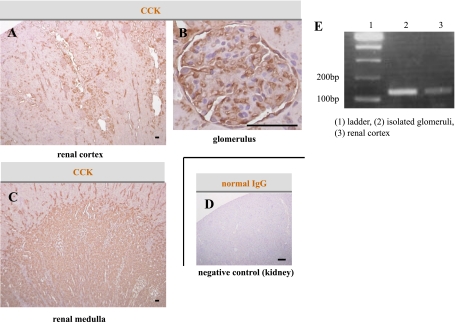
FIG. 3.
Distribution of CCK in the rat renal tissues. A–D: Immunohistological staining of renal tissue specimens obtained from nondiabetic rats. The CCK-positive area was mainly observed in the distal tubules (A), glomeruli (B), and collecting ducts (C). Scale bars, 50 μm. Normal IgG was also used as a negative control (D). Scale bar, 500 μm. E: CCK mRNA expression was observed in isolated glomeruli and the renal cortex obtained from nondiabetic rats. (A high-quality digital representation of this figure is available in the online issue.)

