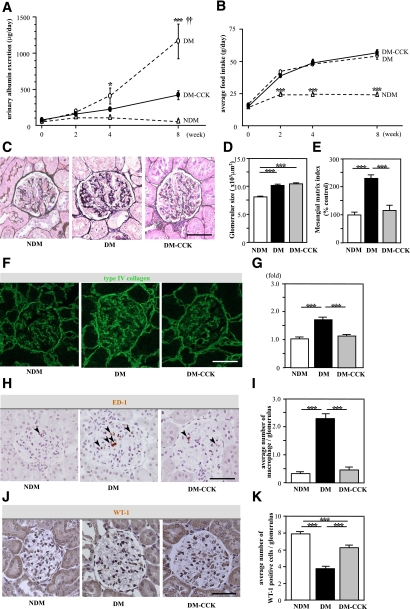
FIG. 4.
CCK-8S ameliorates urinary albumin excretion and inhibits macrophage infiltration in glomeruli. A: Time course of urinary albumin excretion (UAE). The UAE of untreated diabetic rats (DM; ○) was increased progressively compared with that in nondiabetic rats (NDM; △), whereas it was suppressed in CCK-8S–treated diabetic rats (DM-CCK; ●) at week 8 (n = 7/group). Values are the means ± SEM. *P < 0.05 vs. NDM; ***P < 0.001 vs. NDM; ††P < 0.01 vs. DM-CCK. B: There was no difference in the amount of food intake between DM (○) and DM-CCK (●). ***P < 0.001 vs. DM and DM-CCK. Values are the means ± SEM. C: PAM staining of the kidney at 8 weeks. D: Glomerular hypertrophy was observed in both diabetic groups as compared with nondiabetic rats. Values are the means ± SEM. ***P < 0.001. E: Mesangial matrix index was ameliorated in CCK-8S–treated diabetic rats compared with untreated diabetic rats. Values are the means ± SEM. ***P < 0.001. Fifteen randomly selected glomeruli per rat were examined (n = 5/group). F: Expression of type IV collagen in kidney tissue. G: Type IV collagen-positive area in glomeruli (folds versus NDM). Type IV collagen was significantly increased in the DM compared with the DM-CCK group. Fifteen randomly selected glomeruli per rat were examined (n = 4/group). Values are the means ± SEM. ***P < 0.001. H: Macrophage infiltration into glomeruli at 8 weeks. Arrowheads indicate macrophages. I: The average number of intraglomerular macrophages. Macrophage infiltration into glomeruli was remarkable in the DM, whereas it was minimal in the DM-CCK group. Twenty randomly selected glomeruli per rat were examined (n = 4/group). Values are the means ± SEM. ***P < 0.001. J: Expression of WT-1 in glomeruli. K: The average number of WT-1–positive cells in glomeruli. Podocyte loss was inhibited in CCK-8S–treated diabetic rats compared with untreated diabetic rats. Twenty randomly selected glomeruli per rat were examined (n = 4/group). Values are the means ± SEM. ***P < 0.001. Scale bars, 50 μm. (A high-quality digital representation of this figure is available in the online issue.)

