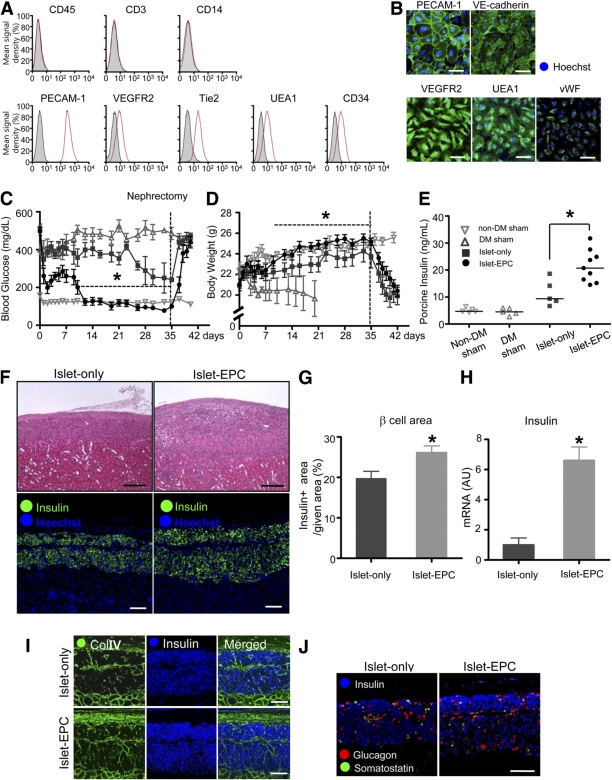
FIG. 1.
Better glycemic control and islet engraftment with EPC cotransplantation. A and B: Cord blood–derived EPCs of passage 3 were harvested and analyzed for expression of EPC markers by fluorescence-activated cell sorting (A) and immunocytostaining (B). EPCs were negative for CD45, CD3, and CD14 expression and positive for PECAM-1, VEGFR2, Tie2, UEA1, CD34, VE-cadherin, and vWF expression. C–E: Islets were transplanted into the kidney capsules of the recipient mice with or without EPCs (n = 6–9 per group). The blood glucose levels (C) and body weights (D) of each group were measured for 42 days after transplantation. E: The fasting serum porcine insulin level was measured with an immunoradiometric assay at day 35 (n = 5–8 per group). F–J: The graft-bearing kidney was harvested at day 35. F: The upper panel shows hematoxylin-eosin staining of the grafts in the islet-only and islet-EPC groups. The lower panel shows the insulin-positive area of each group, as determined by the immunostaining. G: The insulin-positive area was measured and presented as the percentage of a given area (0.72 mm2) (n = 4). H: The graft site of each mouse was analyzed for insulin by q-PCR with porcine-specific primers. The data are presented in arbitrary units (AU) after normalization to glyceraldehyde-3-phosphate dehydrogenase, with the islet-only group set to 1 (n = 4). I: Connective tissue area of the graft was visualized by Col IV together with insulin for β-cells by immunostaining. J: Endocrine cells of the graft were visualized for glucagon (α-cell), somatostatin (δ-cell), and insulin (β-cell) by immunostaining. Scale bars, 100 μm. All data are presented as means ± SE. *P < 0.05 vs. the islet-only group. (A high-quality color representation of this figure is available in the online issue.)

