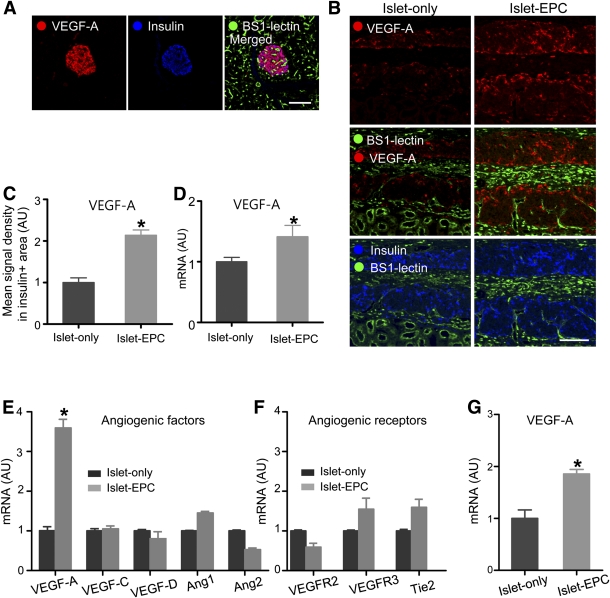
FIG. 3.
The mechanisms underlying the EPC-induced neovascularization in islet transplantation. A: The porcine pancreas was visualized with VEGF-A, insulin, and BS1-lectin immunostaining. B and C: Graft-bearing kidneys were removed at day 14, and the VEGF-A expression was visualized together with the BS1-lectin and insulin immunostaining. B: Representative images of the graft. C: The mean VEGF-A signal density from the insulin-positive area was measured and presented in arbitrary units (AU), with the value of the islet-only group set to 1 (n = 4). D: At day 10, the graft site of each mouse was dissected, harvested, and analyzed for VEGF-A by q-PCR with porcine-specific primers. The data are presented in arbitrary units after normalization to glyceraldehyde-3-phosphate dehydrogenase, with the value for the islet-only group set to 1 (n = 4). E–G: Mouse islets (E and F) or porcine islets (G) were cultivated with human EPCs for 48 h or 4 days, respectively, and harvested for RNA extraction. Mouse and porcine islets were cultivated without EPCs under the same conditions to serve as controls. The angiogenic growth factors and their receptors were evaluated by q-PCR with mouse-specific (E and F) and porcine-specific (G) primers. The data are presented in arbitrary units after normalization to mouse-specific β-actin for the mouse islets or to porcine-specific glyceraldehyde-3-phosphate dehydrogenase for the porcine islets, with the values for the islet-only group set to 1 (n = 3). The data are presented as means ± SE. *P < 0.05 vs. the islet-only group. Scale bars, 100 μm. (A high-quality color representation of this figure is available in the online issue.)

