FIG. 4.
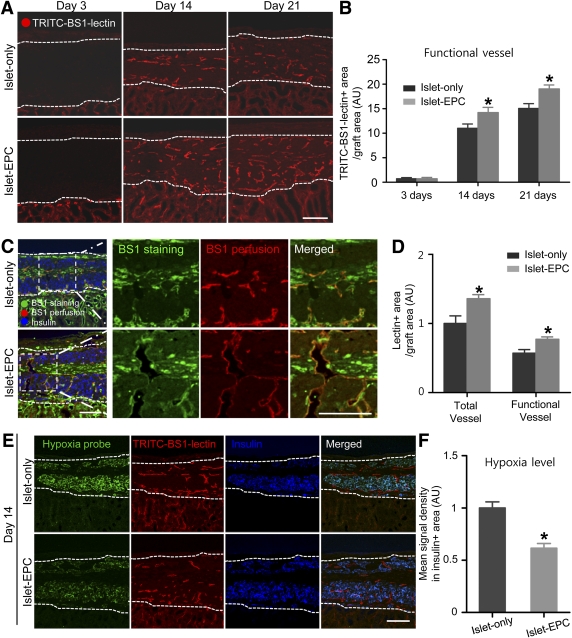
Improvement of graft perfusion and recovery from ischemia by EPC cotransplantation. A and B: The functional blood vessels in the graft were analyzed with TRITC-BS1-lectin perfusion at days 3, 14, and 21 posttransplantation. A: Representative images of the perfused vessels in the graft site. B: The TRITC-positive vessel area in A was calculated as the percentage of the total graft area, and then the values are presented in arbitrary units (AU) with the value of the islet-only group set at day 3 to 1 (n = 4). C and D: The total blood vessels were identified with FITC-BS1-lectin staining together with functional vessels identified with TRITC-BS1-lectin perfusion at day 14. C: Representative images of functional vessels among the entire vessels are presented in the left panel. The right panels show the magnification view of the insert in the white dotted rectangle. D: TRITC-positive functional vessel area and FITC-positive total vessel area were calculated as the percentage of the total graft area, and then the values were presented in arbitrary units with the value of total vessel for the islet-only group set to 1 (n = 4). E and F: The graft ischemia was evaluated by the Hypoxyprobe-positive signal at day 14 in both groups. E: Representative images of the Hypoxyprobe-positive area in the graft are shown, together with the TRITC-BS1-lectin and insulin immunostaining. F: The mean signal density of the Hypoxyprobe from the insulin-positive area was measured and presented in arbitrary units, with the value of the islet-only group set to 1 (n = 4). The data are presented as means ± SE. *P < 0.05 vs. the islet-only group. White dotted lines show the territory of the graft site. Scale bars, 100 μm. (A high-quality color representation of this figure is available in the online issue.)

