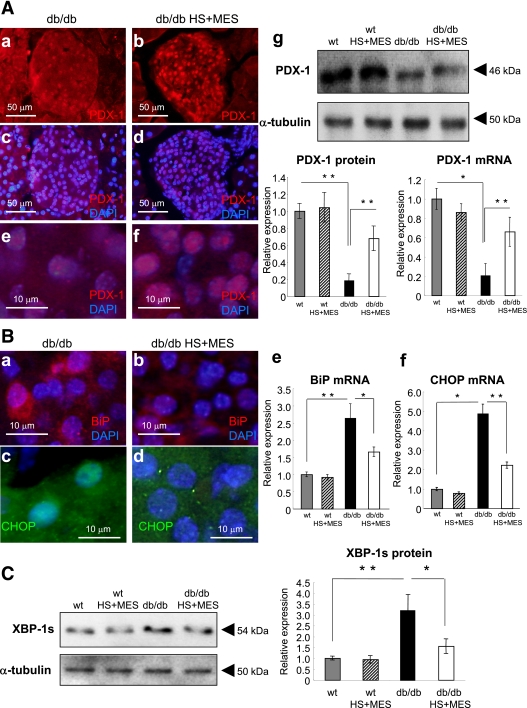
FIG. 5.
PDX-1 expression and ER stress signals in the pancreas. A: Sections of pancreatic specimen were immunostained for PDX-1 (a–f). Representative pancreatic sections from sham-treated and HS+MES-treated db/db mice are shown. PDX-1 protein expression assessed by Western blotting and PDX-1 mRNA expression measured by qRT-PCR were investigated (g). Relative PDX-1 protein and mRNA expression were quantified and corrected using respective internal controls (α-tubulin for protein, β-actin for mRNA) (g). B: Sections of pancreatic specimen were immunostained for BiP (a and b) and CHOP (c and d). Representative pancreatic sections from sham-treated and HS+MES-treated db/db mice are shown. BiP mRNA (e) and CHOP mRNA (f) were quantified by qRT-PCR using LCM. C: XBP-1s protein expression (identified as 54-kDa band) was determined by Western blotting, and the expression levels were corrected using α-tubulin. *P < 0.05, **P < 0.01 vs. indicated group. (A high-quality digital representation of this figure is available in the online issue.)

