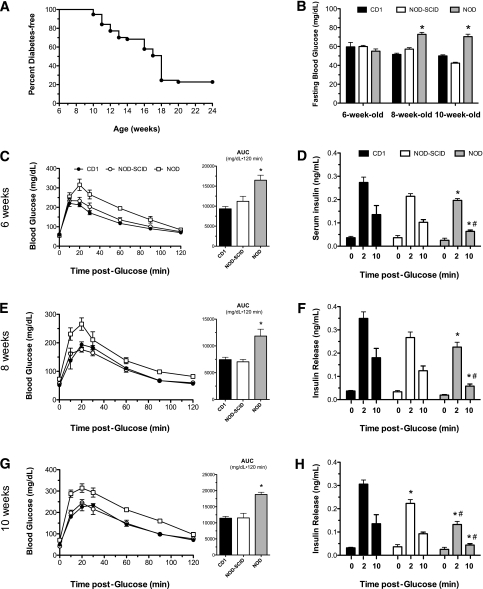
FIG. 1.
Glucose homeostasis in female CD1, NOD-SCID, and prediabetic NOD mice. A: Diabetes incidence in female NOD mice by age. Diabetes was defined as blood glucose >300 mg/dL on two consecutive measurements. n = 57 mice. B: Blood glucose values, as measured following an overnight fast in 6-, 8-, and 10-week-old mice. C, E, and G: Results of glucose tolerance tests and their corresponding area under the curve (AUC) analyses in mice at 6 (C), 8 (E), and 10 (G) weeks of age following intraperitoneal injections of glucose (2 mg/kg). n = 5–6 mice per group. D, F, and H: Serum insulin values in mice at 6 (D), 8 (F), and 10 (H) weeks of age at the indicated times following an intraperitoneal injection of glucose (2 g/kg). n = 3–4 mice per group. *P < 0.05 compared with the corresponding time value for CD1 mice. #P < 0.05 compared with the corresponding time value for NOD-SCID mice.

