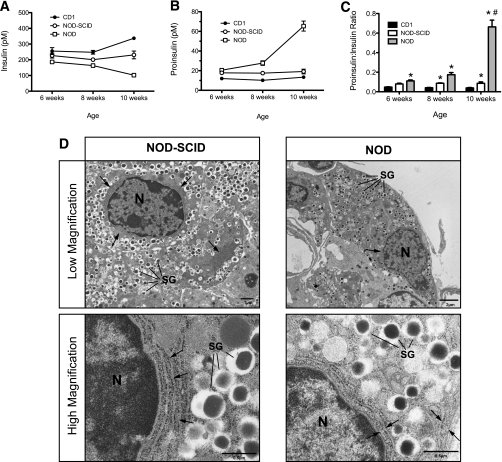
FIG. 3.
Secreted hormone levels and electron microscopic imaging of female prediabetic mice. A: Insulin levels in nonfasting 6-, 8-, and 10-week-old female CD1, NOD-SCID, and prediabetic NOD mice. B: Proinsulin levels in nonfasting 6-, 8-, and 10-week-old CD1, NOD-SCID, and prediabetic NOD mice. C: Proinsulin:insulin ratios in nonfasting 6-, 8-, and 10-week-old CD1, NOD-SCID, and prediabetic NOD mice. D: Representative low- and high-magnification transmission electron microscopic images of β-cells from 10-week-old NOD-SCID and prediabetic NOD mice. Arrows indicate ER. N, nucleus; SG, secretory granule. n = 4–5 mice in panels A–C. *P < 0.05 compared with the corresponding value for CD1 mice. #P < 0.05 compared with the corresponding value for NOD-SCID mice.

