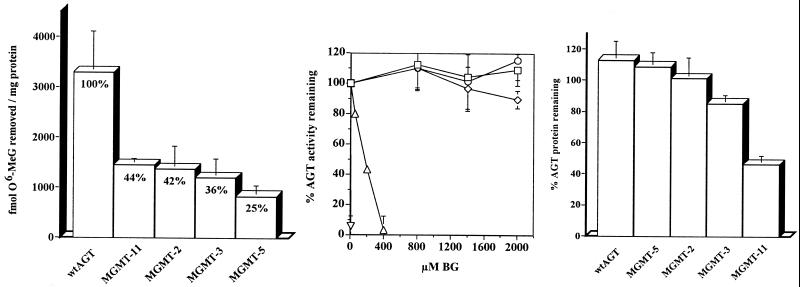
Figure 3.
Comparison of AGT activity (A), BG resistance (B), and protein stability (C) in the mutants AGT-2, -3, -5, and -11 and wt AGT. (A) AGT activity was determined in extracts from retrovirally transduced K562. Activity was normalized to protein expression. Percent values represent mutant AGT activity relative to wt AGT activity. Data represent the mean of five experiments. Bars = SD. (B) BG resistance was determined by preincubation of AGT-2 (□), AGT-3 (⋄), AGT-5 (○), AGT-11 (▵), and wt AGT (▿) transduced cell extracts with 0–2,000 μM BG before quantitation of activity. Data are presented as the percent activity remaining after exposure to BG relative to the activity in non-BG-treated controls. Data represent the mean of four experiments. (C) Protein stability was measured by Western blot comparisons of AGT expression levels in transduced K562 treated with 50 μg/ml cycloheximide for 12 h vs. steady-state AGT levels in untreated cells. Protein levels were determined by densitometric quantitation of signal intensity. Data represent the mean of four experiments.

