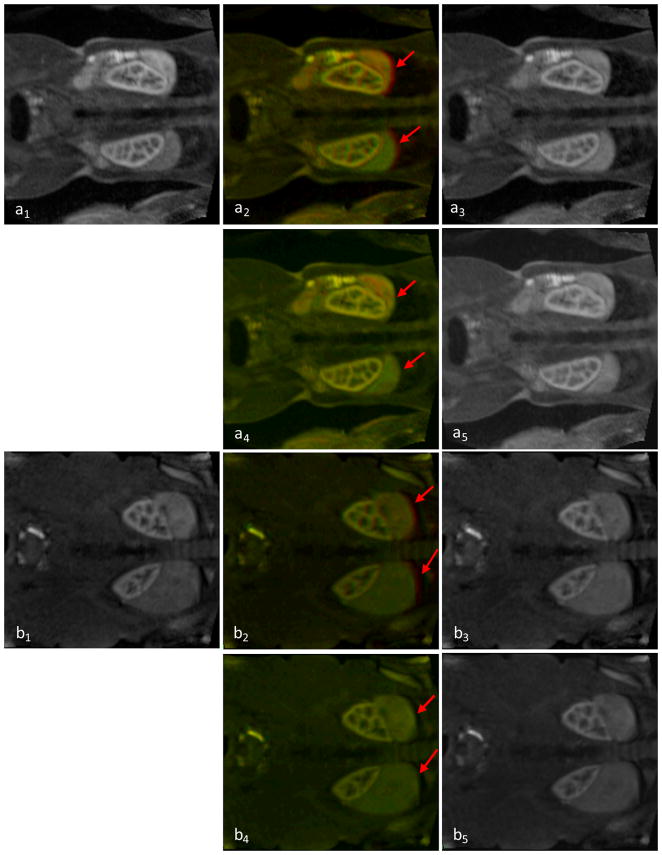
Figure 2.
Visual assessment of DCE-MR images before and after registration. a1 and b1 are a slice of the original reference images from two patients. a2 and b2 are the fusion image before registration, a3 and b3 are the floating image before registration. a4 and b4 are the fusion image after registration, a5 and b5 are the registered image. Red arrows show that the motion before registration and the improvement after registration.

