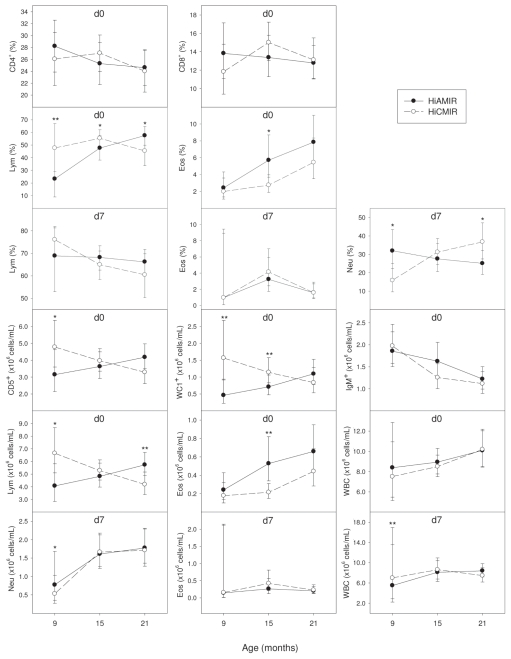
Figure 2.
Effect of immune response phenotype on blood cell populations in heifers before (day 0) and after (day 7) secondary immunization. Values represent least squares means (LSMs) for high antibody-mediated/ low cell-mediated (HiAMIR) and low antibody-mediated/high cell-mediated (HiCMIR) phenotype animals. Error bars represent 95% confidence intervals (CIs). When data were transformed for analysis, values represent back-transformed LSMs and CIs. Cell populations were plotted only if the effect of phenotype on the cell population at day 0 or day 7 varied significantly with age.
*P < 0.05
**P < 0.01

