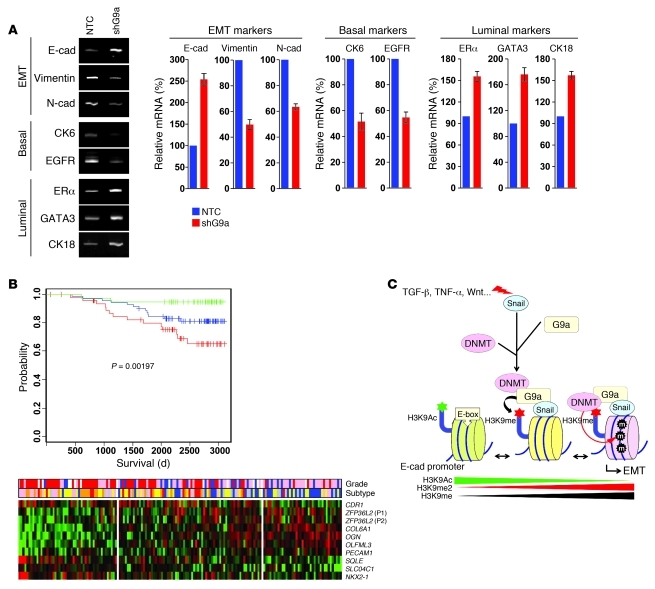
Figure 10. Knockdown of G9a expression alters the expression of epithelial and mesenchymal markers associated with EMT.
(A) The differentially expressed markers for EMT and basal and luminal breast cancer from MDA-MB231 cells and the corresponding stable clone with knockdown of G9a expression were analyzed by quantitative RT-PCR. (B) Kaplan-Meier overall survival curve separates the tumors (from GSE1456) into 3 groups with expression of a 9-gene prognostic signature (top panel). Expression of the 9-gene signature in 159 breast cancer patients is shown in the heatmap (bottom panel). Top bars: tumor grade (1: blue, 2: pink, 3: red) and tumor subtypes (normal-like: blue, luminal A: yellow, luminal B: orange, basal: pink, HER2-positive: red]). P1, probe 1; P2, probe 2. (C) A proposed model to illustrate the interaction of Snail with G9a and DNMTs leading to E-cadherin promoter methylation and EMT induction (see Discussion).

