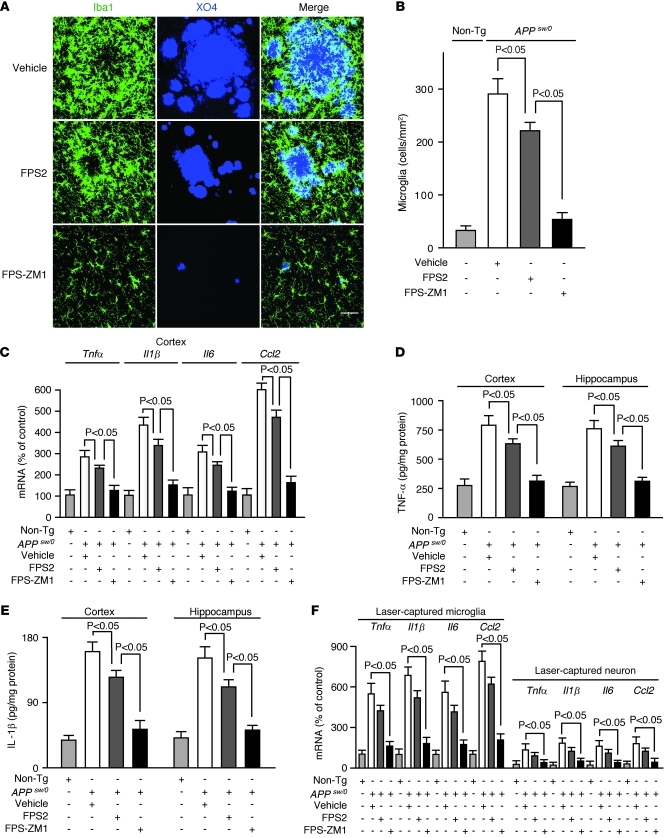
Figure 5. FPS-ZM1 and FPS2 control the neuroinflammatory response in 17-month-old APPsw/0 mice.
(A) Confocal microscopy analysis of Iba1-positive microglia (green) and methoxy X04–positive amyloid-β (blue) and merged images. Scale bar: 50 μm. (B) Microglia numbers in the cortex. (C–E) Relative mRNA expression levels of Tnfα, Il1β, Il6, and Ccl2 determined by qRT-PCR (C), TNF-α (D), and IL-1β (E) protein levels determined by ELISA in the cortex and hippocampus. (F) Relative mRNA expression levels of Tnfα, Il1β, Il6, and Ccl2 in laser-captured microglia and neurons determined by qRT-PCR. APPsw/0 mice were treated with vehicle, FPS2, or FPS-ZM1 for 2 months starting at 15 months of age. Values are mean ± SEM. n = 5 mice per group.

