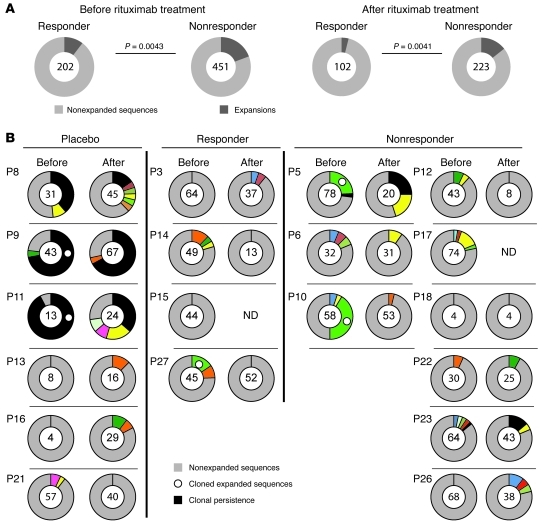
Figure 5. Higher load of IgM memory B cell expansions and persistence of expanded IgM memory B cells is associated with a poor clinical response to rituximab.
(A) IgM memory expansions before and after rituximab therapy in pooled samples from clinical responders and nonresponders. Results are based on the analysis of individual sequences in both clinical subgroups. Numbers within circles indicate the number of individual sequences analyzed per patient cohort and time point. The 2-tailed Fisher exact test was used to compare proportions of clonal expansions. (B) IgM memory B cell expansions in individual clinical responders or nonresponders compared with placebo-treated patients. Gray shading, nonexpanded sequences; differently colored shading, clonally expanded CDR3 sequences; black shading, sequences detected before and after therapy in individual patients are highlighted in black. Circles denote expanded sequences that were resurrected as IgG monoclonal antibodies (see Figure 3B). Due to the low frequency of memory B cells in 2 post-treatment samples, we were not able to amplify PCR products (ND, not determined).

