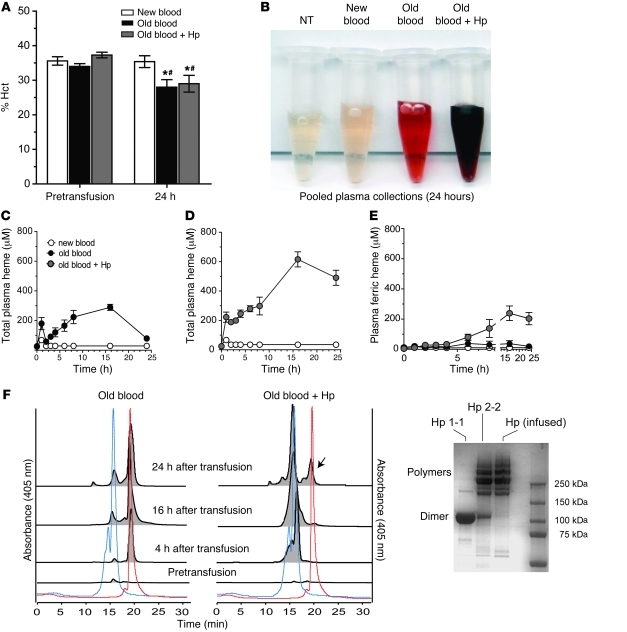
Figure 2. In vivo Hb exposure after blood transfusion with or without Hp.
(A) The percentage Hct did not differ among groups immediately prior to transfusion (P > 0.05). Animals transfused with old blood with or without Hp demonstrated small but significantly decreased Hct levels over the 24 hours after transfusion compared with their own groups baseline (*P < 0.05) and new-blood transfusion at 24 hours (#P < 0.05). (B) Aliquot of pooled plasma obtained over the 24-hour collection period. (C) Plasma Hb as total heme concentrations over time compared with new blood. (D) Plasma Hb as total heme after old-blood transfusion plus Hp coinfusion. (E) The contribution of HbFe3+ or met-heme accumulation in plasma over time. The AUC0–24h values are described in the Results, with AUC0–24h for old blood transfusion, with or without Hp, greater than that for new blood (P < 0.05), and AUC0–24h for old blood plus Hp transfusion greater than that for old blood (P < 0.05). (F) Distribution between free Hb and Hp-bound Hb (Hb-Hp complex) in plasma over 24 hours evaluated by size-exclusion chromatography of plasma. The red and blue dotted lines represent Hb and Hb-Hp standards, respectively. Representative samples at 4, 16, and 24 hours indicate free Hb after old-blood transfusion and Hp-bound Hb after old blood plus Hp transfusion. The arrow indicates the presence of free Hb by 24 hours in the old blood plus Hp group. The distribution of standard Hp isoforms 1-1 and 2-2 and infused Hp is shown.

