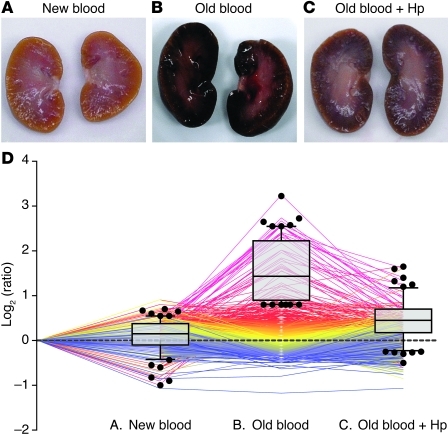
Figure 4. Initial tissue screening — gross pathology and proteomic profiling.
(A–C) Gross morphologic changes in kidneys of animals transfused with (A) new blood, (B) old blood, and (C) old blood plus Hp at 24 hours. (D) All proteins that were identified/quantified in at least 2 out of 4 experiments are shown as color-coded lines that represent the relative abundance across the 3 treatment conditions (compared with nontreated [represented by the dotted line]). The proteins that were identified as overrepresented (>2 SD) in animals transfused with old blood are shown in the box plot overlay. Each symbol represents an individual animal. Box plots represent 25%, 50%, and 75% percentiles, horizontal bars represent median values, and whiskers indicate 10% to 90% percentiles.

