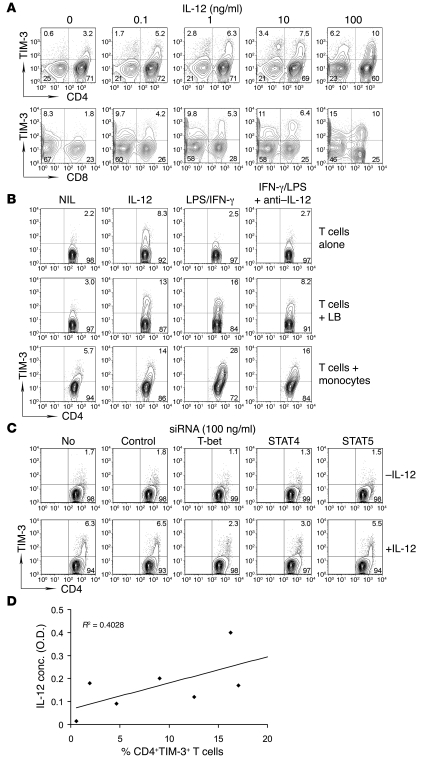
Figure 5. Effect of IL-12 on TIM-3 expression on T cells in FL.
(A) Effect of IL-12 on TIM-3 expression in CD4+ (upper panel) or CD8+ (lower panel) T cells. T cells were cultured in OKT3-coated (0.2 μg/ml) plates with anti-CD28 Abs in the presence or absence of a series of doses of IL-12 for 3 days. TIM-3 expression was measured by flow cytometry (n = 10). (B) Representative dot plots showing TIM-3 expression on CD4+ T cells cocultured either alone (upper panel) or with lymphoma B cells (middle panel) or monocytes (lower panel) in the presence or absence of IL-12, LPS, or LPS/IFN-γ alone or combined with a neutralizing anti–IL-12 Ab (n = 3). (C) Representative dot plots showing TIM-3 expression on CD4+ T cells transfected with siRNA for T-bet, STAT4, or STAT5 in the presence (lower panel) or absence (upper panel) of IL-12 (n = 4). Mock transfection or transfection with scrambled siRNA was used as a control. Percentages of total cell numbers are indicated. (D) A scatter graph showing a correlation between IL-12 serum levels and numbers of CD4+TIM-3+ T cells in FL patients prior to treatment. IL-12 serum levels and numbers of CD4+TIM-3+ T cells in the total MC population of FL specimens were measured by multiplex ELISA and flow cytometry, respectively.

