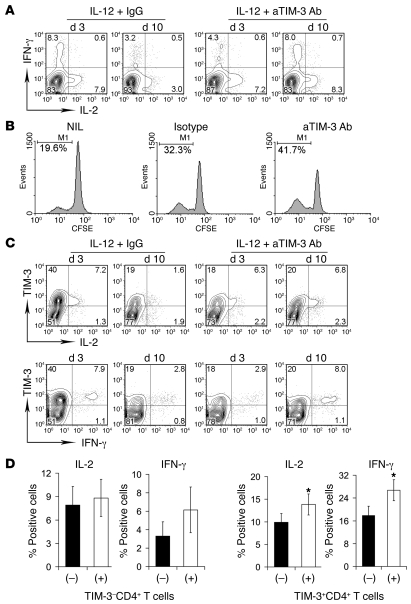
Figure 6. Effect of blockade of TIM-3 signaling on restoration of IL-12–mediated T cell dysfunction.
(A) Representative dot plots showing IL-2 and IFN-γ production in CD4+ T cells treated with either anti–TIM-3 Ab or isotype IgG in the presence of IL-12 at different time points (n = 5). IL-2 and IFN-γ production were detected by intracellular staining. (B) Representative histograms showing proliferation of CD4+ T cells treated with or without anti–TIM-3 Abs or isotype IgG control. Proliferation was measured by CFSE staining and expressed as the number of CFSEdim cells. (C) Representative dot plots showing IL-2 (upper panels) and IFN-γ (lower panels) production in TIM-3– or TIM-3+ CD4+ T cells treated with either anti–TIM-3 Abs or isotype IgG in the presence of IL-12 at different time points (n = 5). IL-2 and IFN-γ production were detected by intracellular staining. Percentage of total cell numbers are indicated (A and C). (D) A summary of frequency of IL-2– or IFN-γ–producing cells in TIM-3– or TIM-3+ CD4+ T cells treated with either anti–TIM-3 Ab (+) or isotype IgG (–) in the presence of IL-12 for 10 days (n = 5). IL-2 or IFN-γ production in TIM-3– or TIM-3+ CD4+ T cells was measured by intracellular staining and calculated as percentage of total CD4+ cells. Data are shown as mean ± SD. *P < 0.05.

