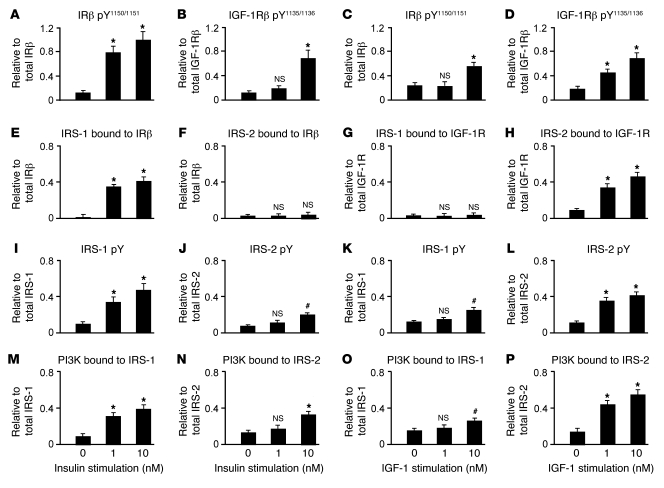
Figure 2. At near-physiological doses (1 nM), insulin and IGF-1 activate different IRS signaling pathways.
This was demonstrated with ex vivo stimulation of HF and cerebellar cortex samples from 8 N humans with low PMIs. Data from the HF are shown. The effect of 0, 1, and 10 nM insulin and IGF-1 is shown on IRβ and IGF-1Rβ activation (A–D), IRS-1 and IRS-2 binding of IRβ and IGF-1Rβ (E–H), IRS-1 and IRS-2 activation (I–L), and PI3K p85α binding to IRS-1 and IRS-2 (M–P). 1 nM insulin activated IRβ, but not IGF-1Rβ, and bound IRS-1, but not IRS-2, to its receptor. In contrast, 1 nM IGF-1 activated IGF-1Rβ, but not IRβ, and bound IRS-2, but not IRS-1, to its receptor. Values (mean ± SEM) are ratios of phosphorylated or bound molecules to total levels of those molecules or of the molecules to which they were bound. #P < 0.01, *P < 0.001 vs. baseline (0 nM). Sample Western blots on which these graphs were based are shown in Figures 3 and 4.

