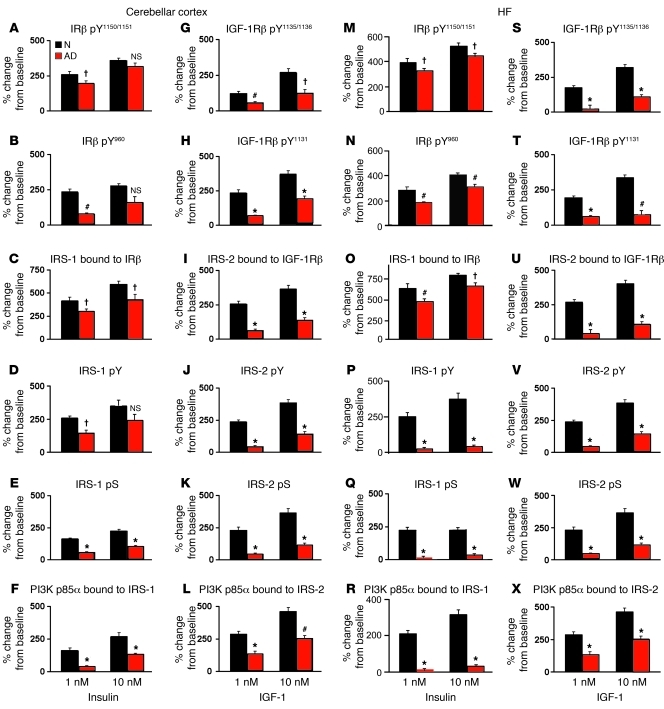
Figure 5. Direct demonstration of insulin and IGF-1 resistance in the cerebellar cortex (A–L) and HF (M–X) of AD cases without diabetes.
Both structures showed reduced responsiveness to near-physiological doses (1 nM) of insulin and IGF-1, as seen in receptor activation (A, B, G, H, M, N, S, and T); IRS-1 bound to IRβ and IRS-2 bound to IGF-1Rβ (C, I, O, and U); IRS-1 or IRS-2 activation (pY) or suppression (pS) (D, E, J, K, P, Q, V, and W); and PI3K p85α bound to IRS-1 or IRS-2 (F, L, R, and X). Values (mean ± SEM) for N and AD cases denote percent increase in signaling responses above baseline (0 nM) in the same diagnostic group. Percentages were calculated from response strengths expressed as ratios of the phosphorylated or bound molecule to the total level of the same molecule or of the molecule to which it was bound (Supplemental Tables 2–5). Unlike the HF, insulin resistance to 1 nM insulin in the cerebellar cortex was overcome at most levels of the signaling pathway by 10 nM insulin. Unlike insulin resistance, IGF-1 resistance was profound even at the receptor level. †P < 0.05, #P < 0.01, *P < 0.001 vs. N. See Tables 1–4 for quantification.

